
Assignment 2
by
Jackson Huckaby
Try several graphs of
![]()
on the same axes.
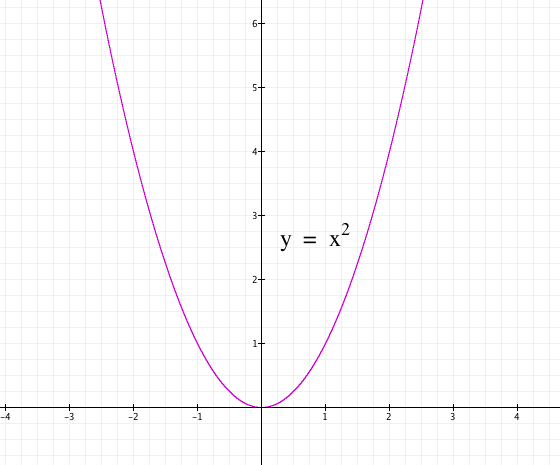
First we will use a=1.
Next we will manipulate the values of a to see the effects on our parabola.
First we will examine the affects of when a>1.
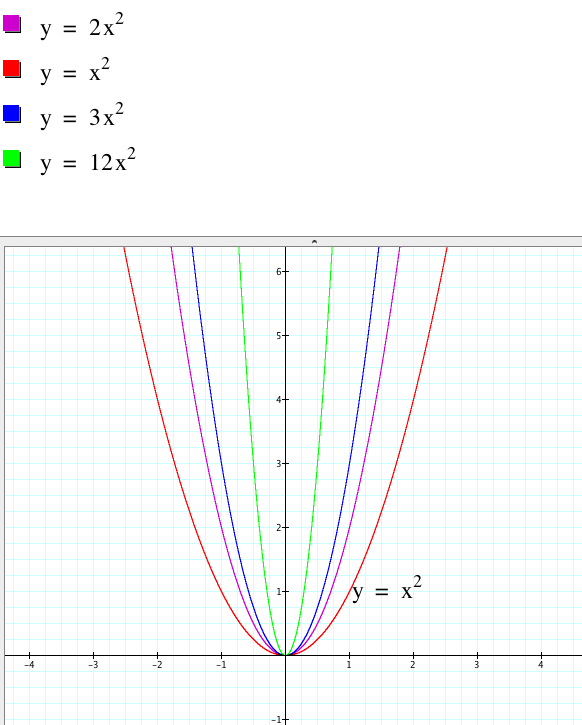
Here we substituted a with values of 1,2,3, and 12. We can see by examining the effects on the graph that as a increases the parabola undergoes a vertical stretch.
Next we will explore the effects when 0<a<1.
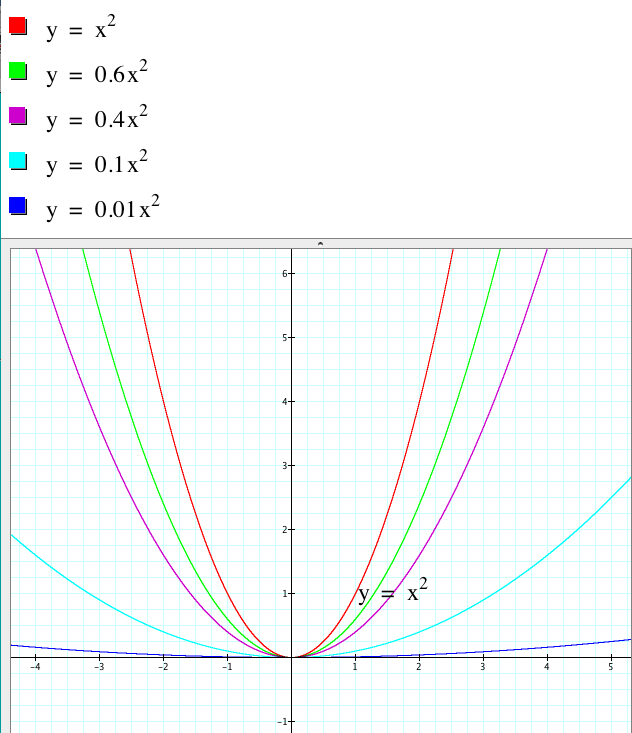
When substituting a for the values on the right, we see that as a approaches 0 it approaches the x axis. This can be viewed as a horizontal stretch.
Below is an animation of our equation ![]() . We have n varying between -10 and 10 to create the movie shown below.
. We have n varying between -10 and 10 to create the movie shown below.
One thing we did not discuss about a was what happened when A<0, or A is negative.
The easiest approach is to ignore the negative and deal with the value of A to find your stretch factor. The negative merely represents a reflection
over the x axis.